Numerical Simulations
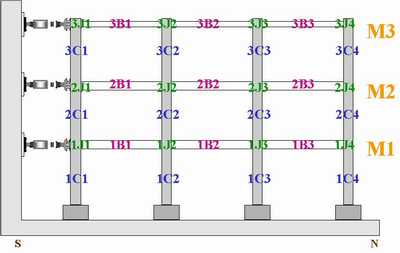
Researchers are making extensive use of the structural analysis platform, OpenSees, to simulate the nonlinear frame response to input ground motions. This page reviews some of the analyses that have been performed up to this point in order to predict the behavior of this frame during the actual test. The following figure depicts the nomenclature used in the results that follow.
Flexibility-based
beam-column fiber elements, beam-column joint elements, and steel and concrete
material models have been calibrated to data from subassembly tests of RC
columns and composite beam-column connections conducted at NCREE earlier this
year.
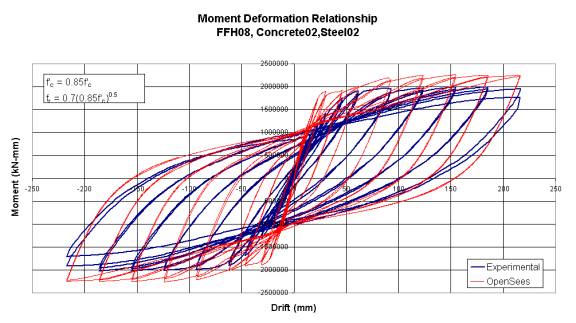
The
RC Columns are modeled using OpenSees material models Concrete02
and Steel02
to represent the core/cover concrete and the reinforcing steel,
respectively. The following shows a
comparison between the OpenSees model and an actual experiment (Tsai 2002).
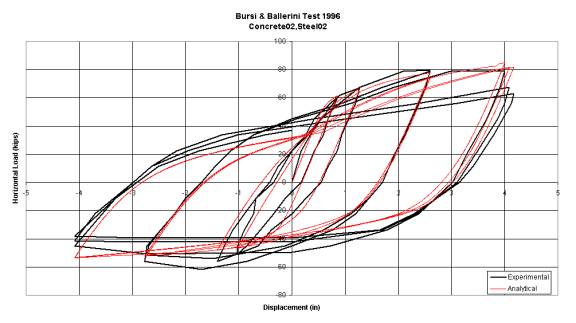
The composite beams are also modeled using Steel02 and Concrete02 to represent the steel beam and the concrete slab. The following shows a comparison of the OpenSees model and a test from Bursi/Ballerini (1996).
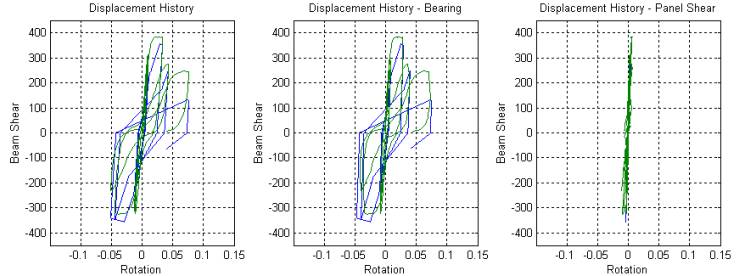
The
composite joints are modeled with a simple joint element that correctly models
the kinematics of a finite joint and utilizes a nonlinear spring to represent
the failure mechanisms. The Steel02 and
Hysteretic
material models are used to represent this spring for both panel shear and
bearing failure, respectively. The
following shows a comparison between the OpenSees model and an actual
experiment (Kanno 1993).
The
model includes a leaning column to represent the P-delta forces generated by
the theoretical interior gravity frames.
This model has equal mass applied to each floor (M1=M2=M3=645kips).
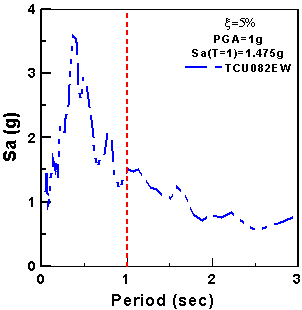
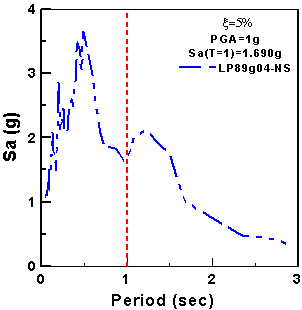
The
response spectrums of the two earthquakes, each scaled to a PGA of 1g, are
shown in the following figures.
RESULTS
TCU082 – EW
50%in50year record scaled
to a PGA of 0.275g
Equal Masses
(M1=M2=M3=645kips)
1. Displacement
and Story Shear Response
LP89G04 – NS
10%in50year record scaled
to a PGA of 0.427g
Equal Masses
(M1=M2=M3=645kips)
1. Displacement
and Story Shear Response
TCU082 – EW
2%in50year record scaled
to a PGA of 0.622g
Equal Masses (M1=M2=M3=645kips)
1. Displacement
and Story Shear Response
TEST SIMULATION
In order to simulate the
actual testing conditions, we must subject the analytical model of the frame to
the following four consecutive earthquakes:
1. 50%in50year
TCU082-EW
2. 10%in50year
LP89G04-NS
3. 2%in50year
TCU082-EW
4. 10%in50year
LP89G04-NS
Therefore each earthquake
following the 1st record will start with a damaged structure and
possibly some residual drift. The
results of these analyses are presented here.
EQ#1
- TCU082 – EW
50%in50year
record scaled to a PGA of 0.275g
Equal
Masses (M1=M2=M3=645kips)
5. Displacement
and Story Shear Response
EQ#2
- LP89G04 – NS
10%in50year
record scaled to a PGA of 0.427g
Equal
Masses (M1=M2=M3=645kips)
5. Displacement
and Story Shear Response
EQ#3
- TCU082 – EW
2%in50year
record scaled to a PGA of 0.622g
Equal Masses (M1=M2=M3=645kips)
5. Displacement
and Story Shear Response
6. RC
Column Behavior
7. Composite
Beam Behavior
8. Composite
Joint Behavior
EQ#4
- LP89G04 – NS
10%in50year
record scaled to a PGA of 0.427g
Equal
Masses (M1=M2=M3=645kips)
9. Displacement
and Story Shear Response
10. RC
Column Behavior
11. Composite
Beam Behavior
12. Composite
Joint Behavior